Understanding Crashes and Crash Logs
Understanding Crashes and Crash Logs
WWDC 2018
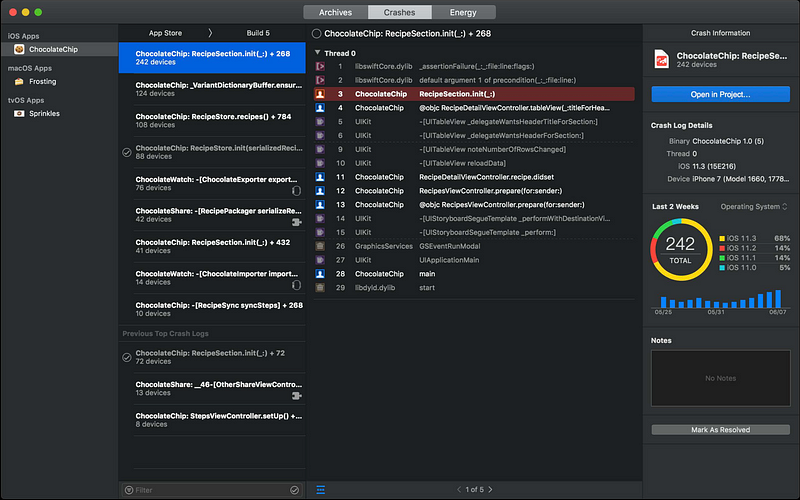
Crashes Organizer
Xcode → Window → Organizer (Shift + Command + 6)
Device Window
You can get logs from a device.
Automated testing
Symbolication
- Upload app symbols for server-side symbolication
- Keep your app archive for local symbolication
- Download debug symbols for bitcode apps
Analyzing Crash Logs
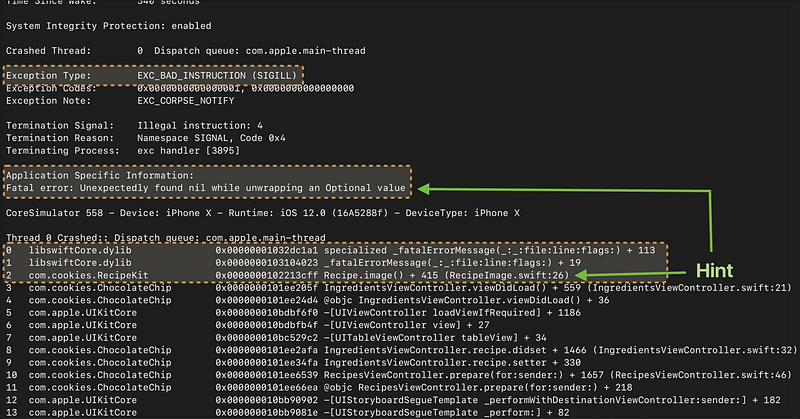
Assertions and Preconditions
- Forced unwrap of an Optional that stores nil
- Out of bounds Array access
- Swift arithmetic overflow
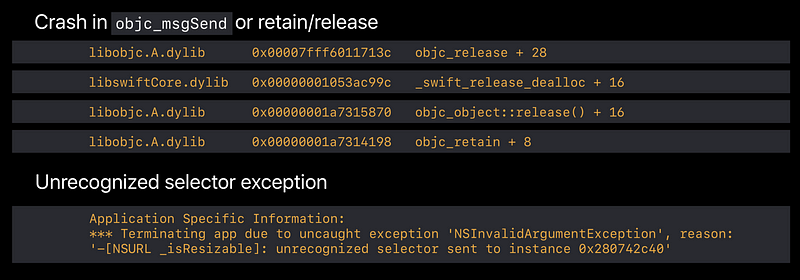
- Uncaught exception
- Custom assertion in your code
Terminations by the Operating System
- Watchdog events (time out)
- Device overheated
- Memory exhaustion
- Invalid code signature
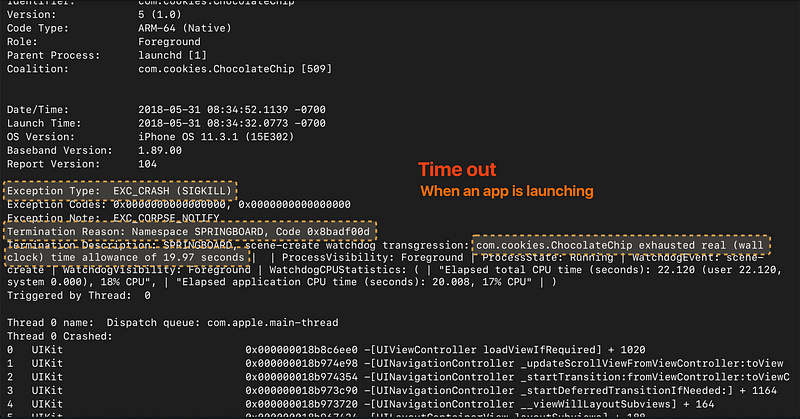
Avoiding Launch Timeouts
- Test your app without the debugger
- Test your app on a real device
- Test your app on older hardware
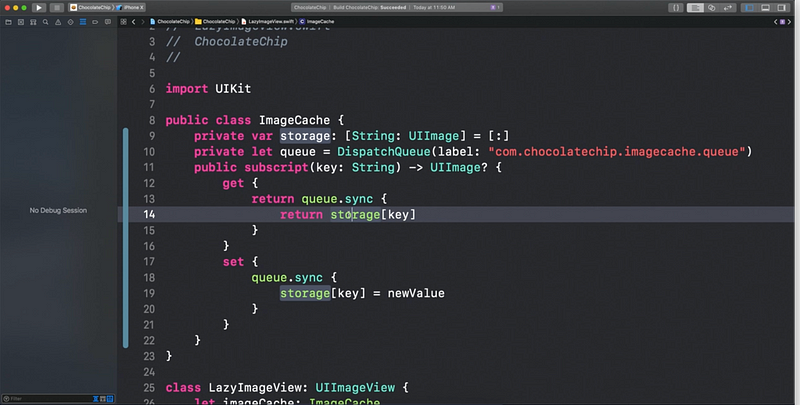
Memory Errors
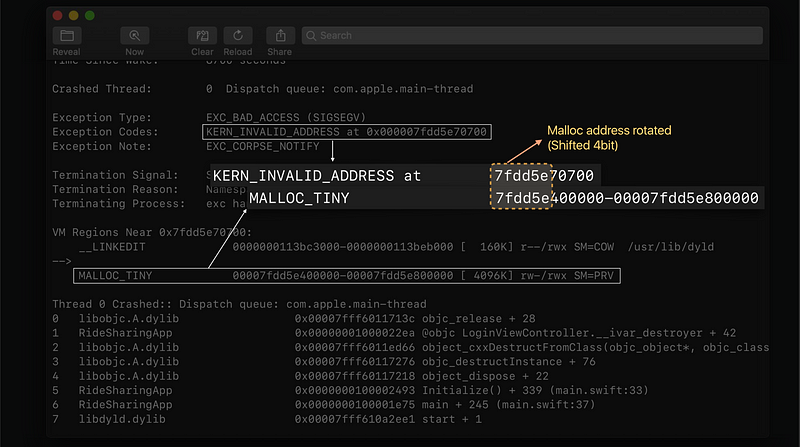
Object life cycle
Dealloc → Freed object → Rotate
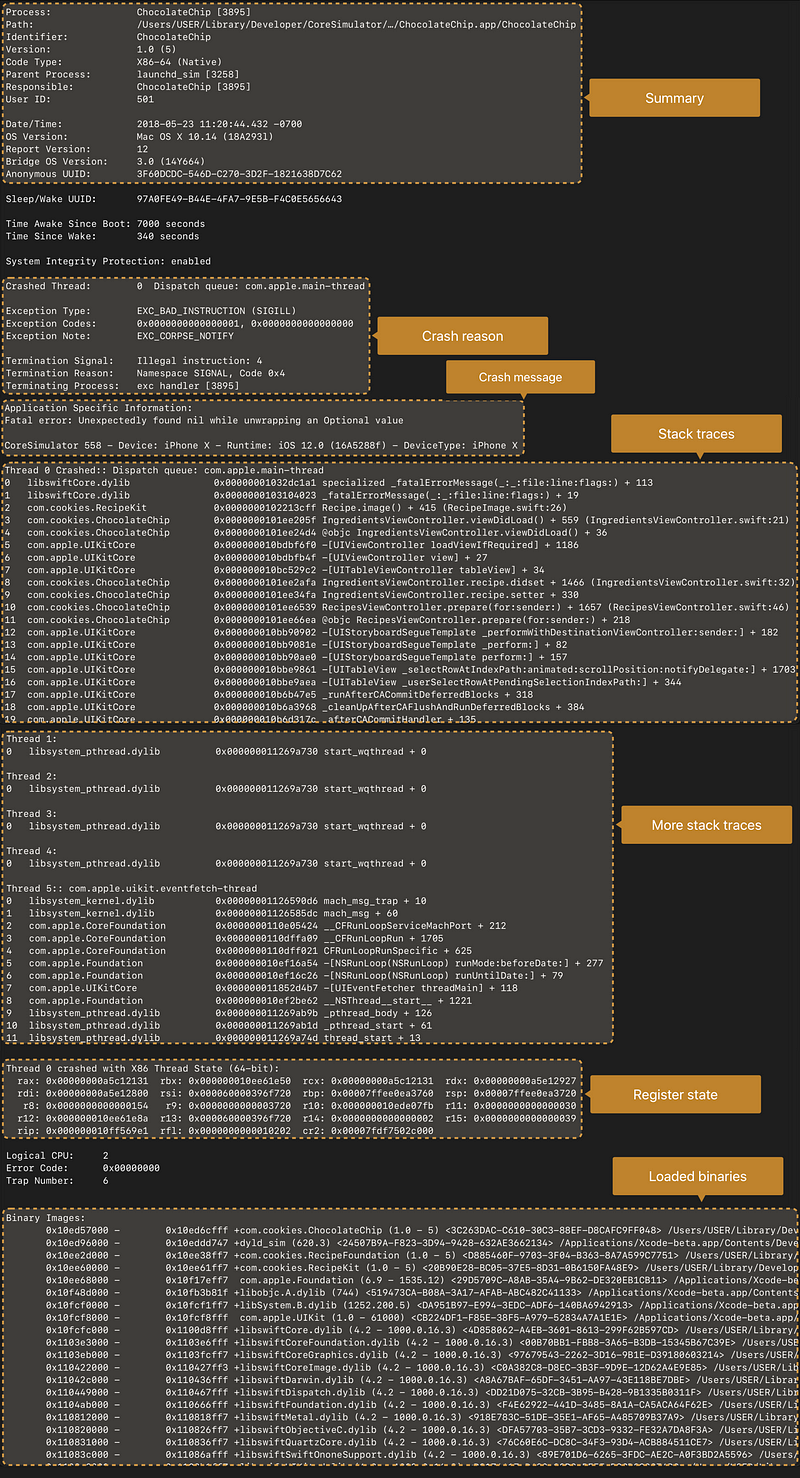
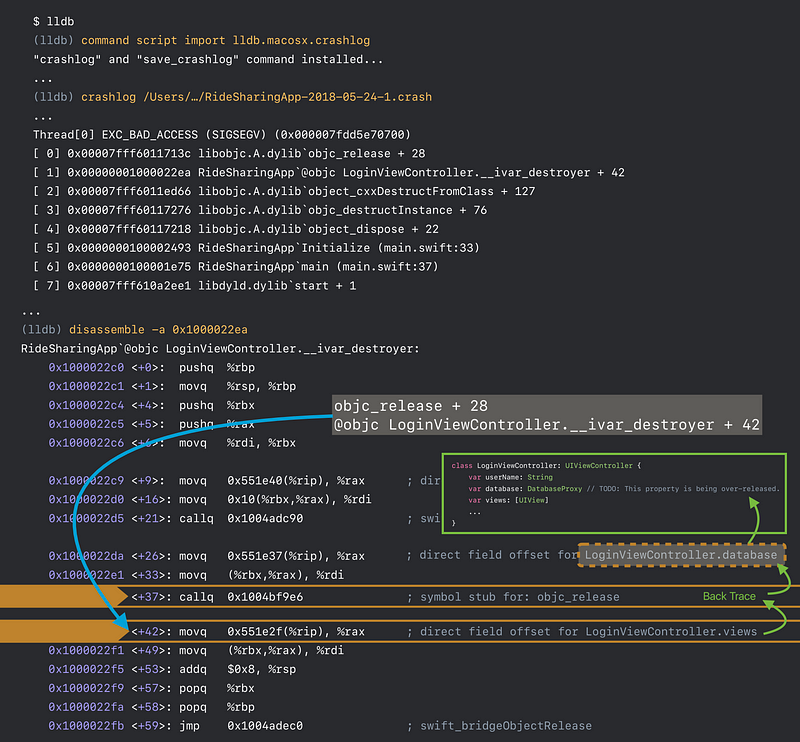
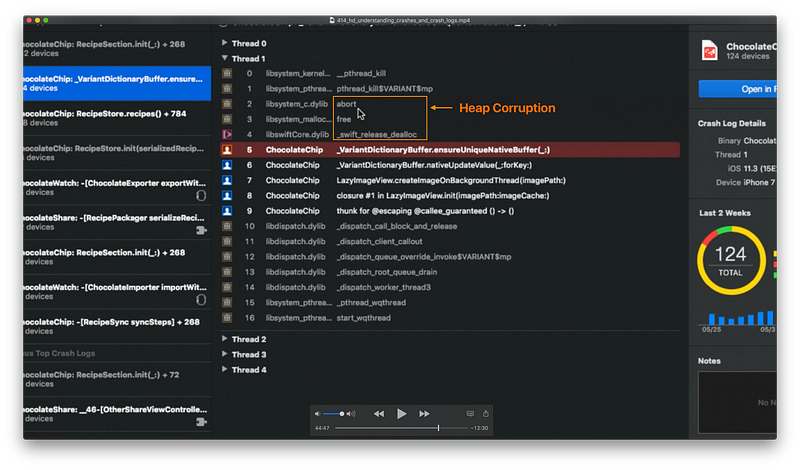
Crash Log Analysis
- Understand the crash reason
- Examine the crashed thread’s stack trace
- Look for more clues in bad address and disassembly 👍
Common Memory Error Symptoms
Crash Analysis Tips
- Look at code other than the line that crashed
- Look at thread stack traces other than the crashed thread
- Look at more than one crash log
- Use Address Sanitizer and Zombies to reproduce memory errors
Multithreading Issues
Use theThread Sanitizer to fix multi-threading issues
Demo
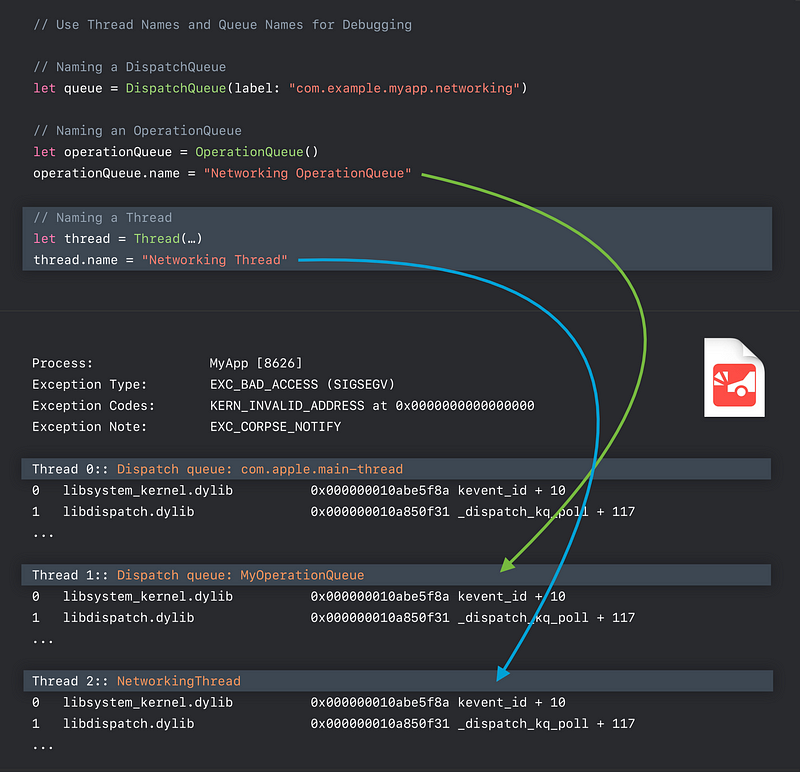
Tips
Use the thread name