Advanced Debugging with Xcode and LLDB
Advanced Debugging with Xcode and LLDB
WWDC 2018
“Failed to get module from AST context”

Swift Type Resolution

Advanced Debugging Tips and Tricks
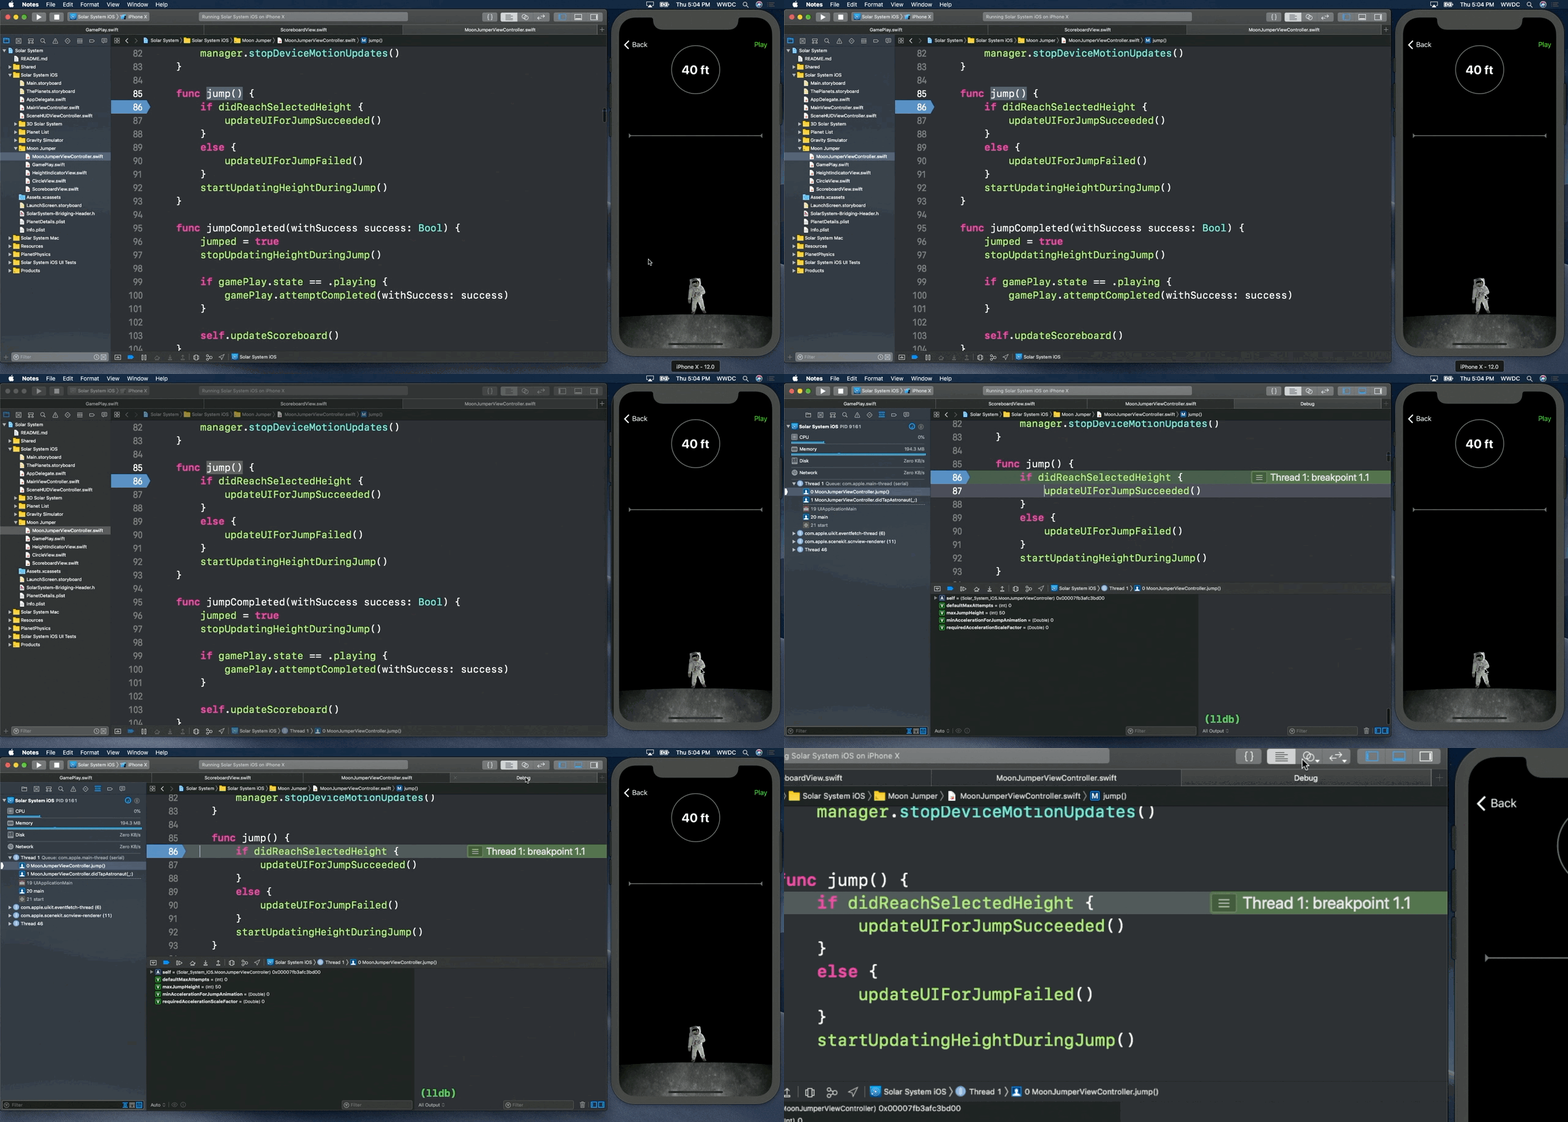
Debug Tab 👍
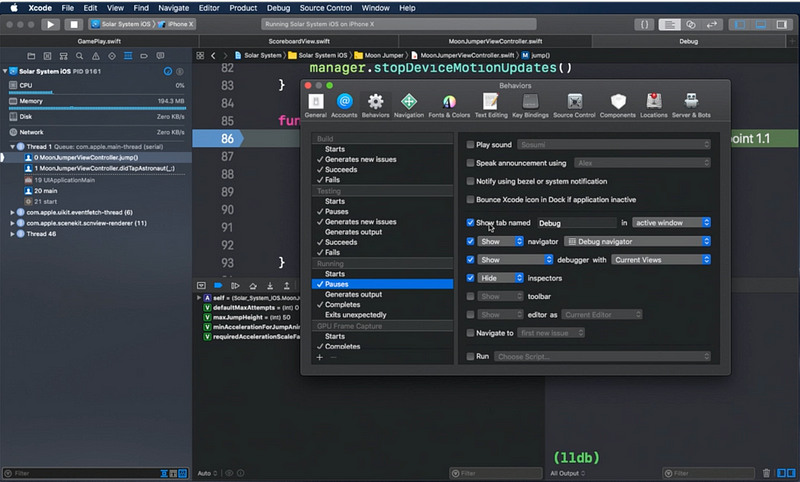
expression (change a value)
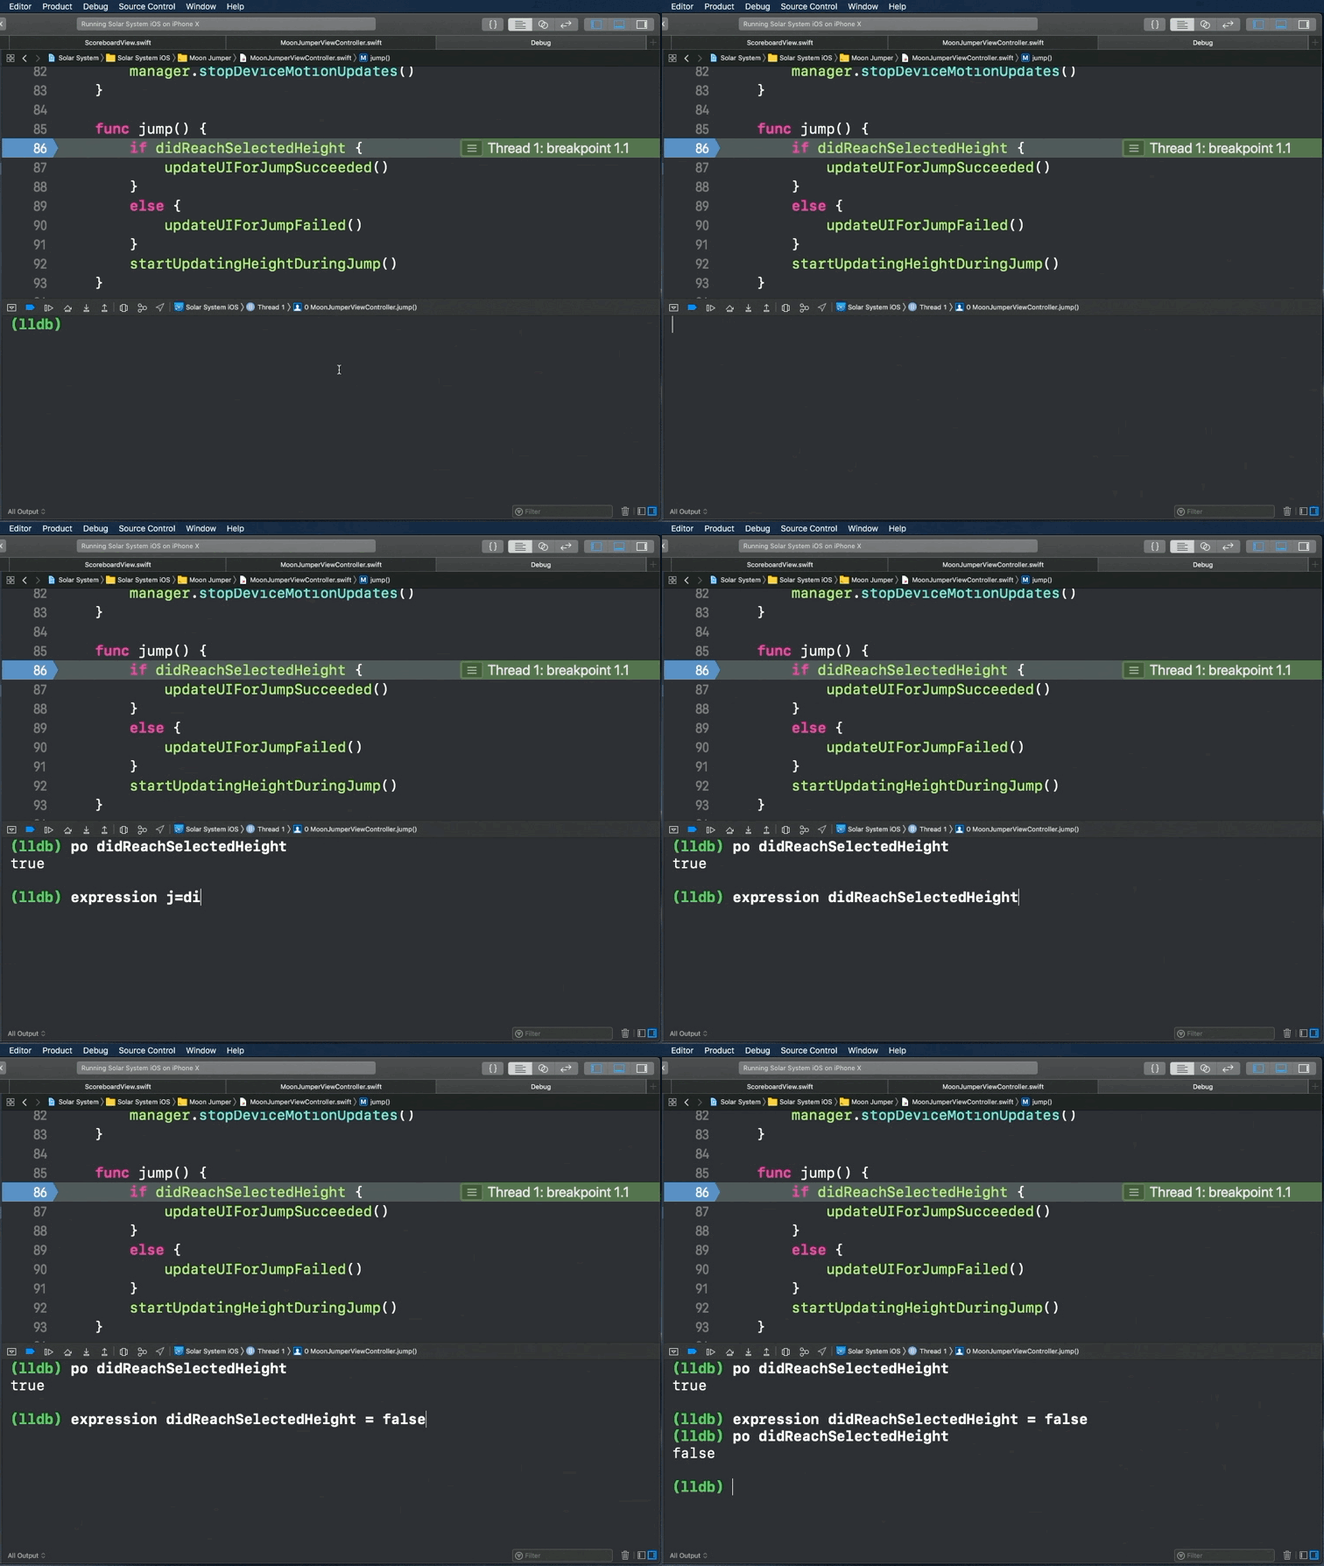
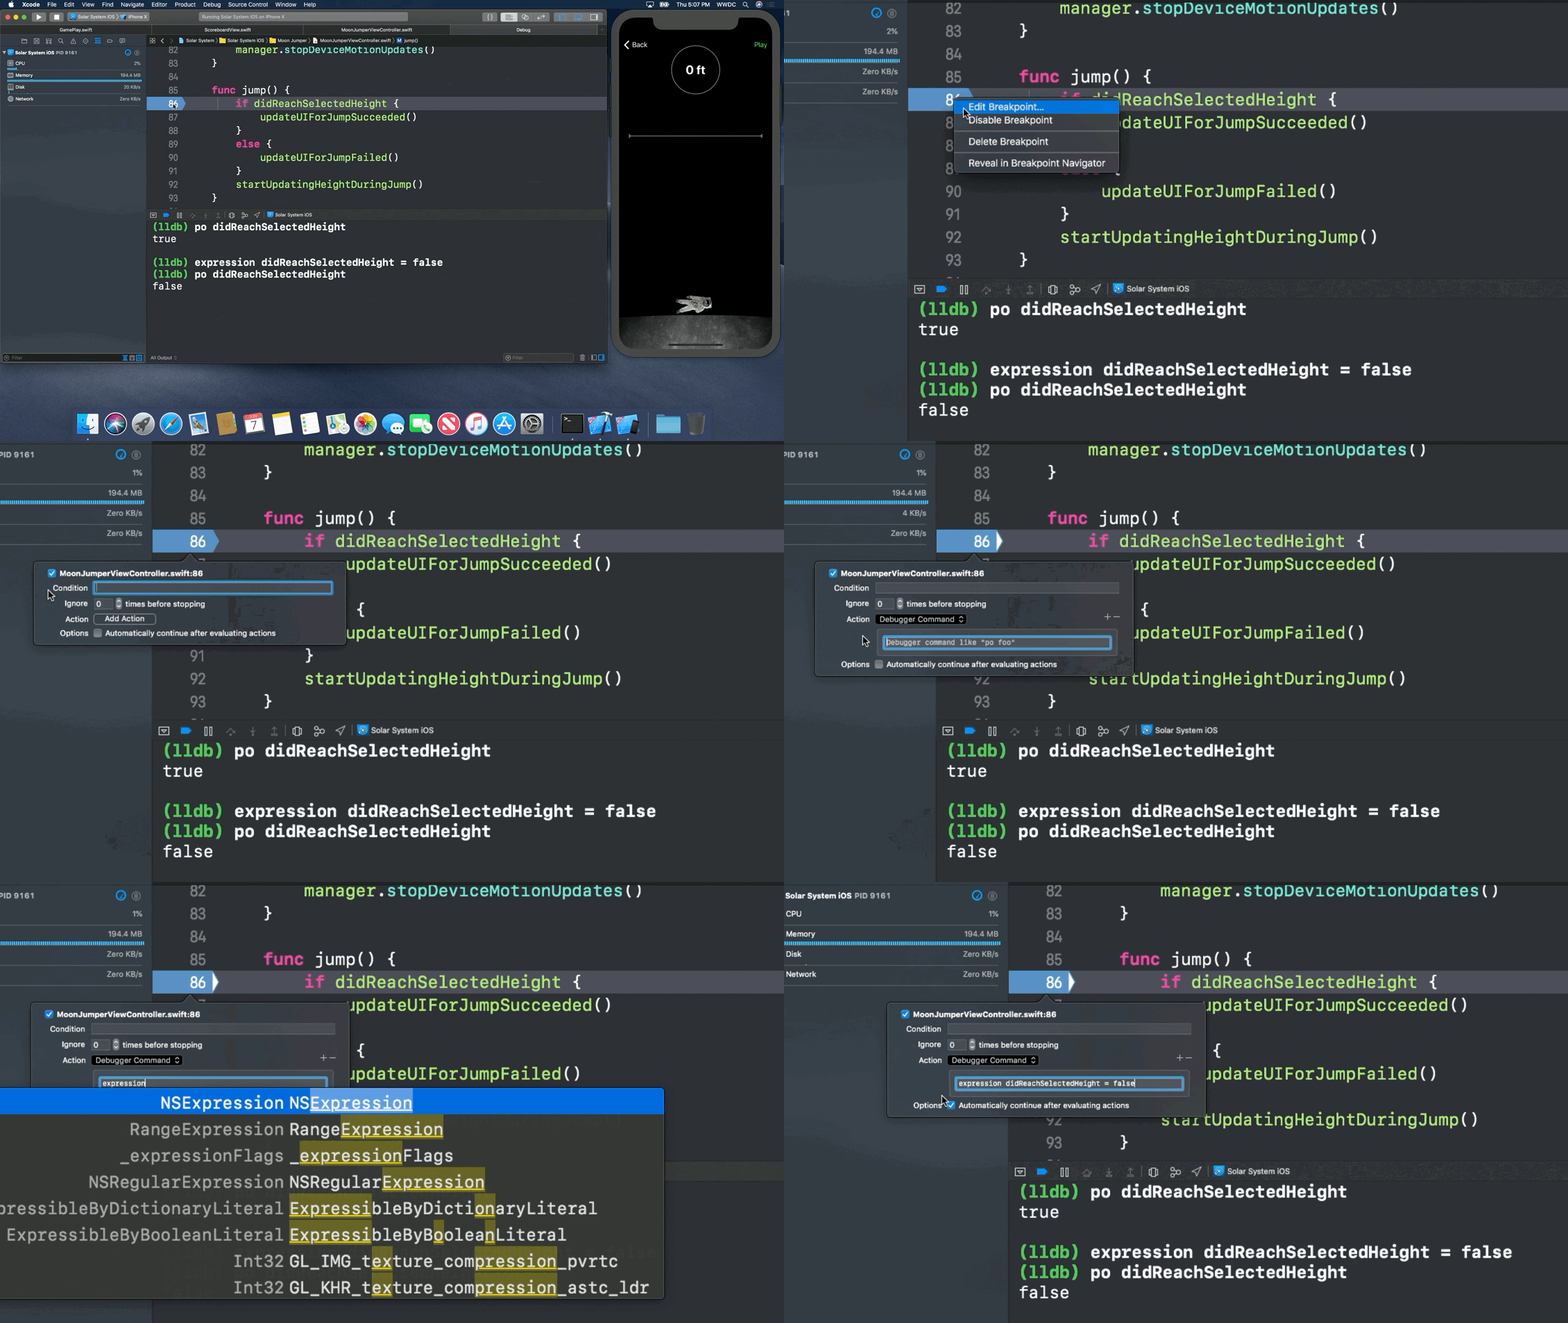
You can test your code without reRun 👍
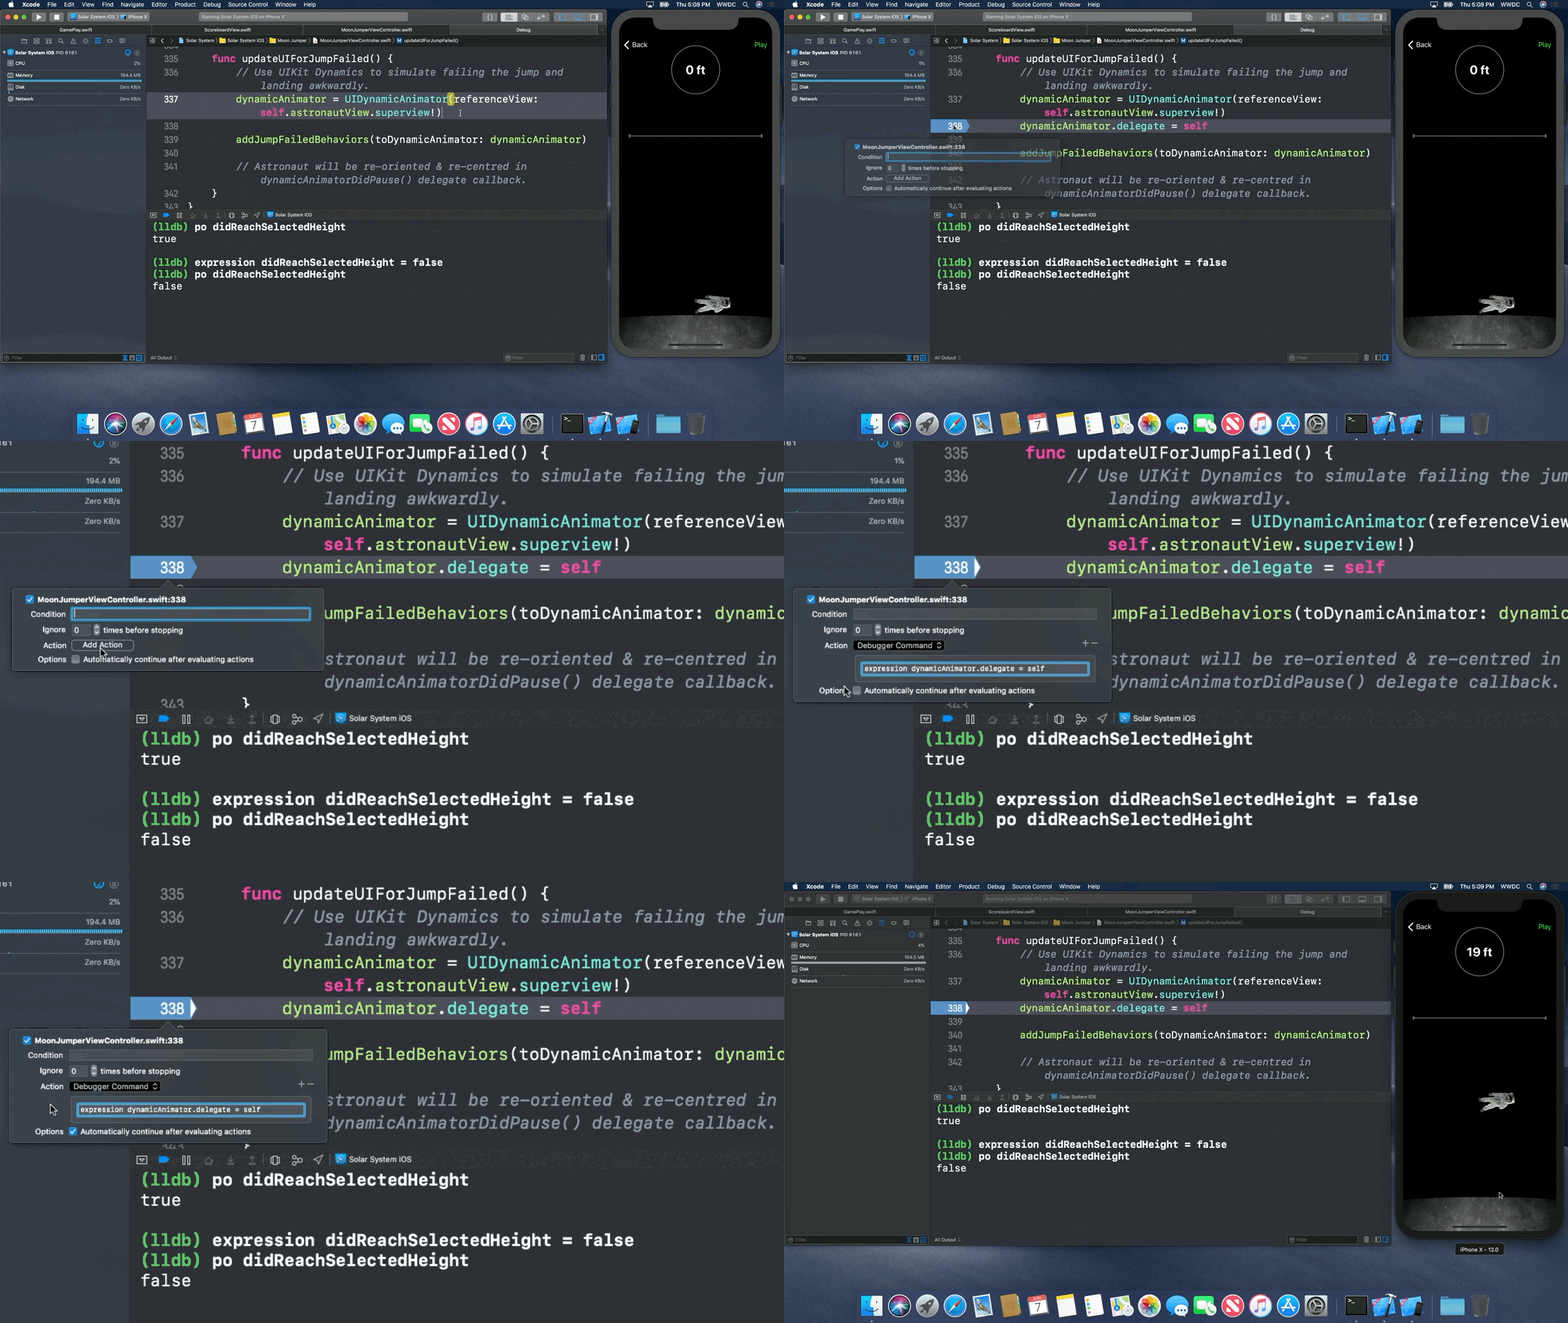
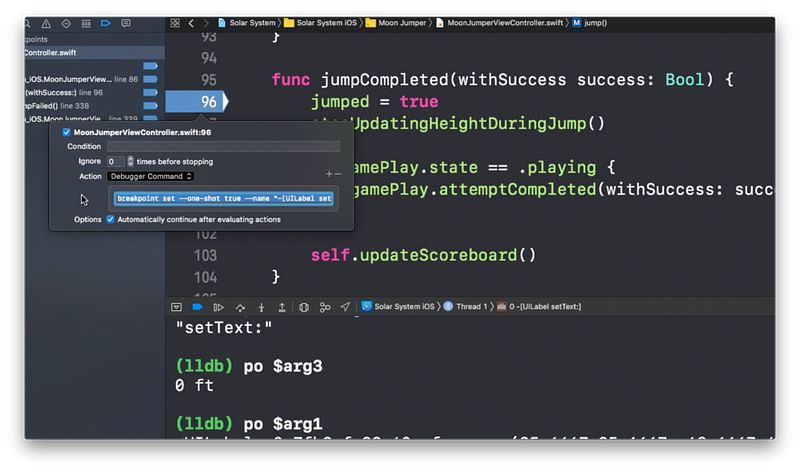
Symbolic Breakpoint
- symbolic breakpoint → use commands ($arg1, $arg2, etc) for more detail
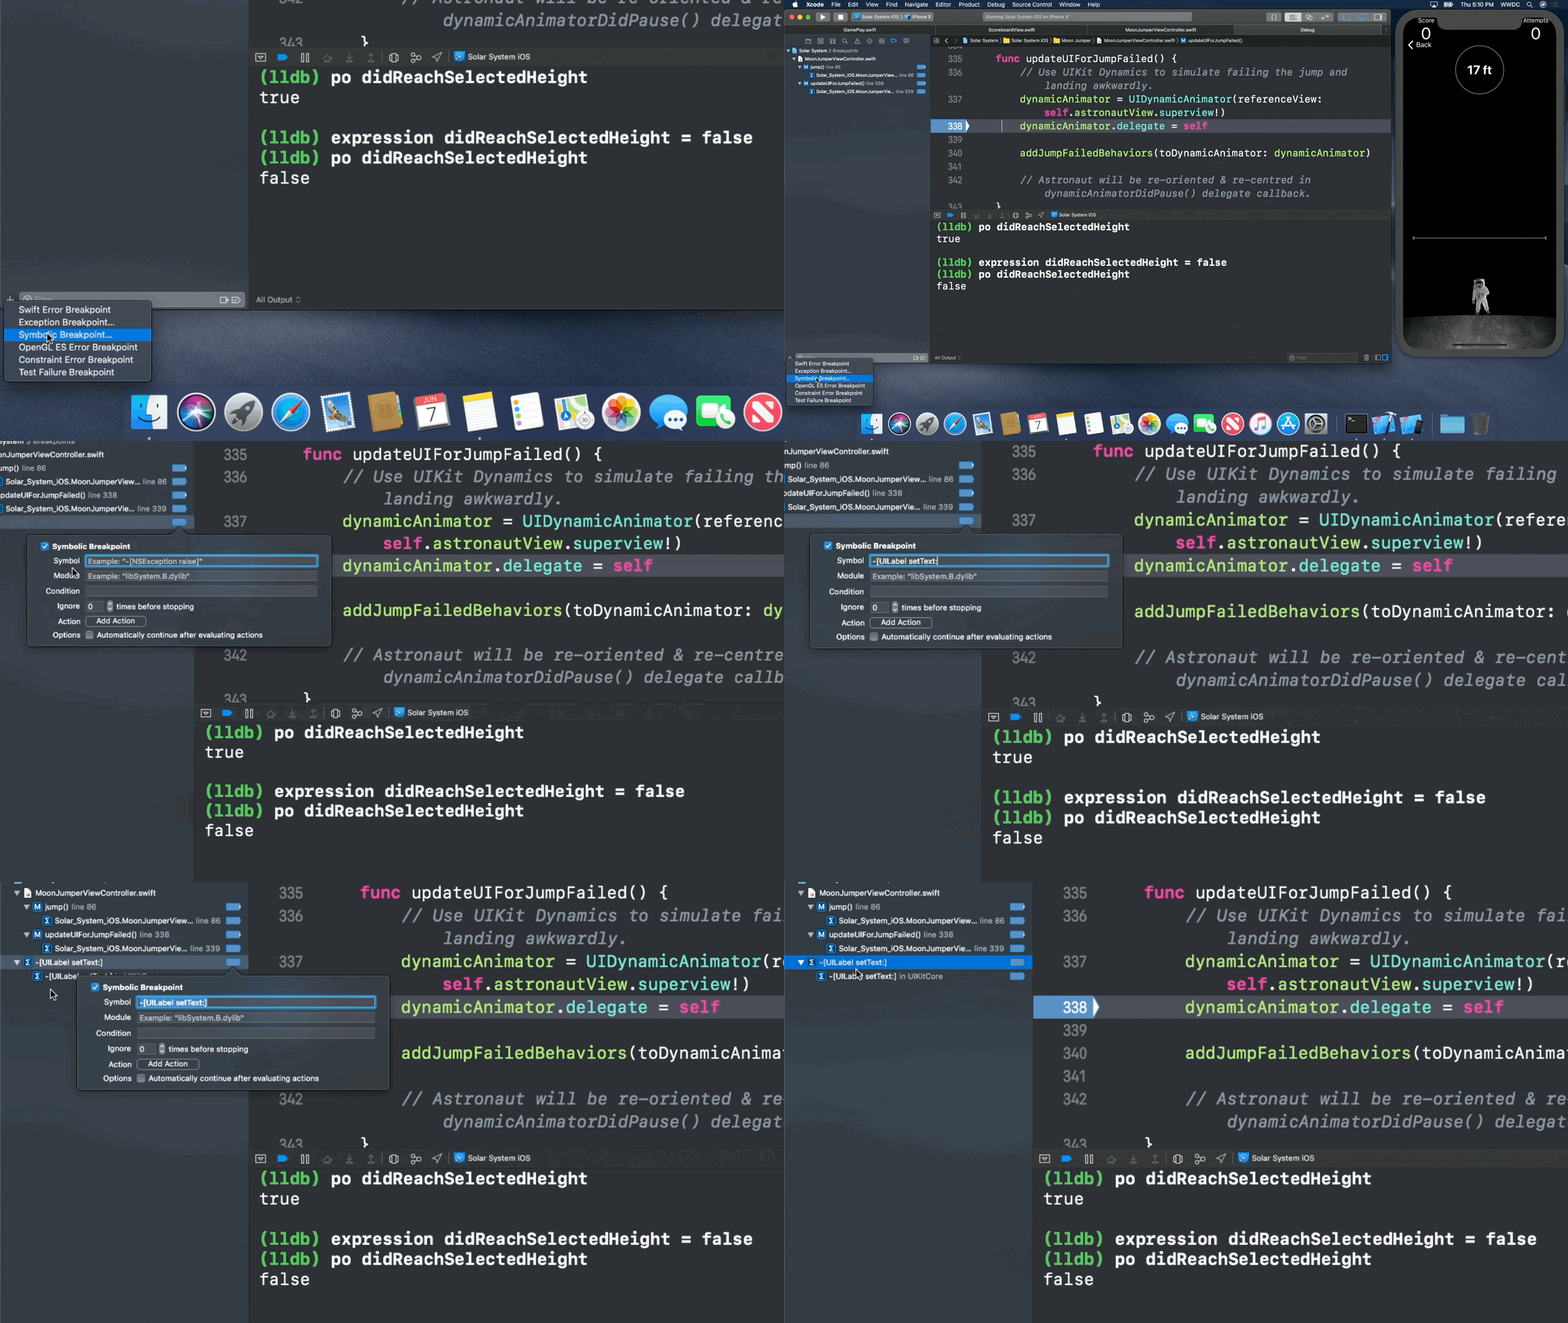
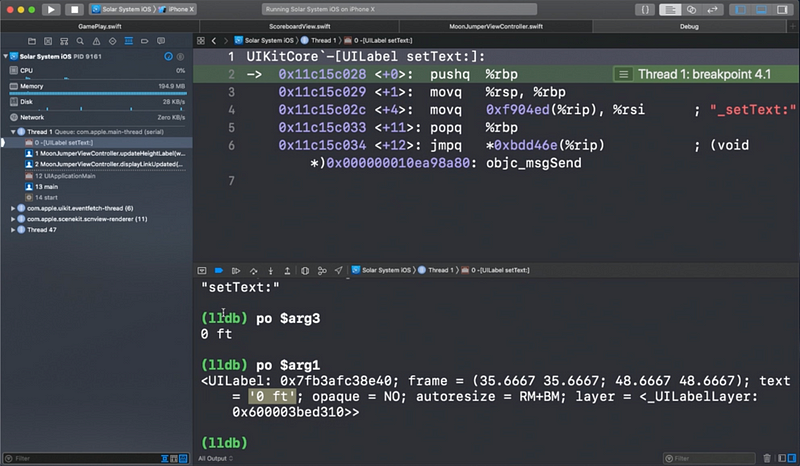
One shot breakpoint
- Temporary breakpoint that’s automatically deleted
- breakpoint set --one-shot true --name “-[UILabel setText:]”
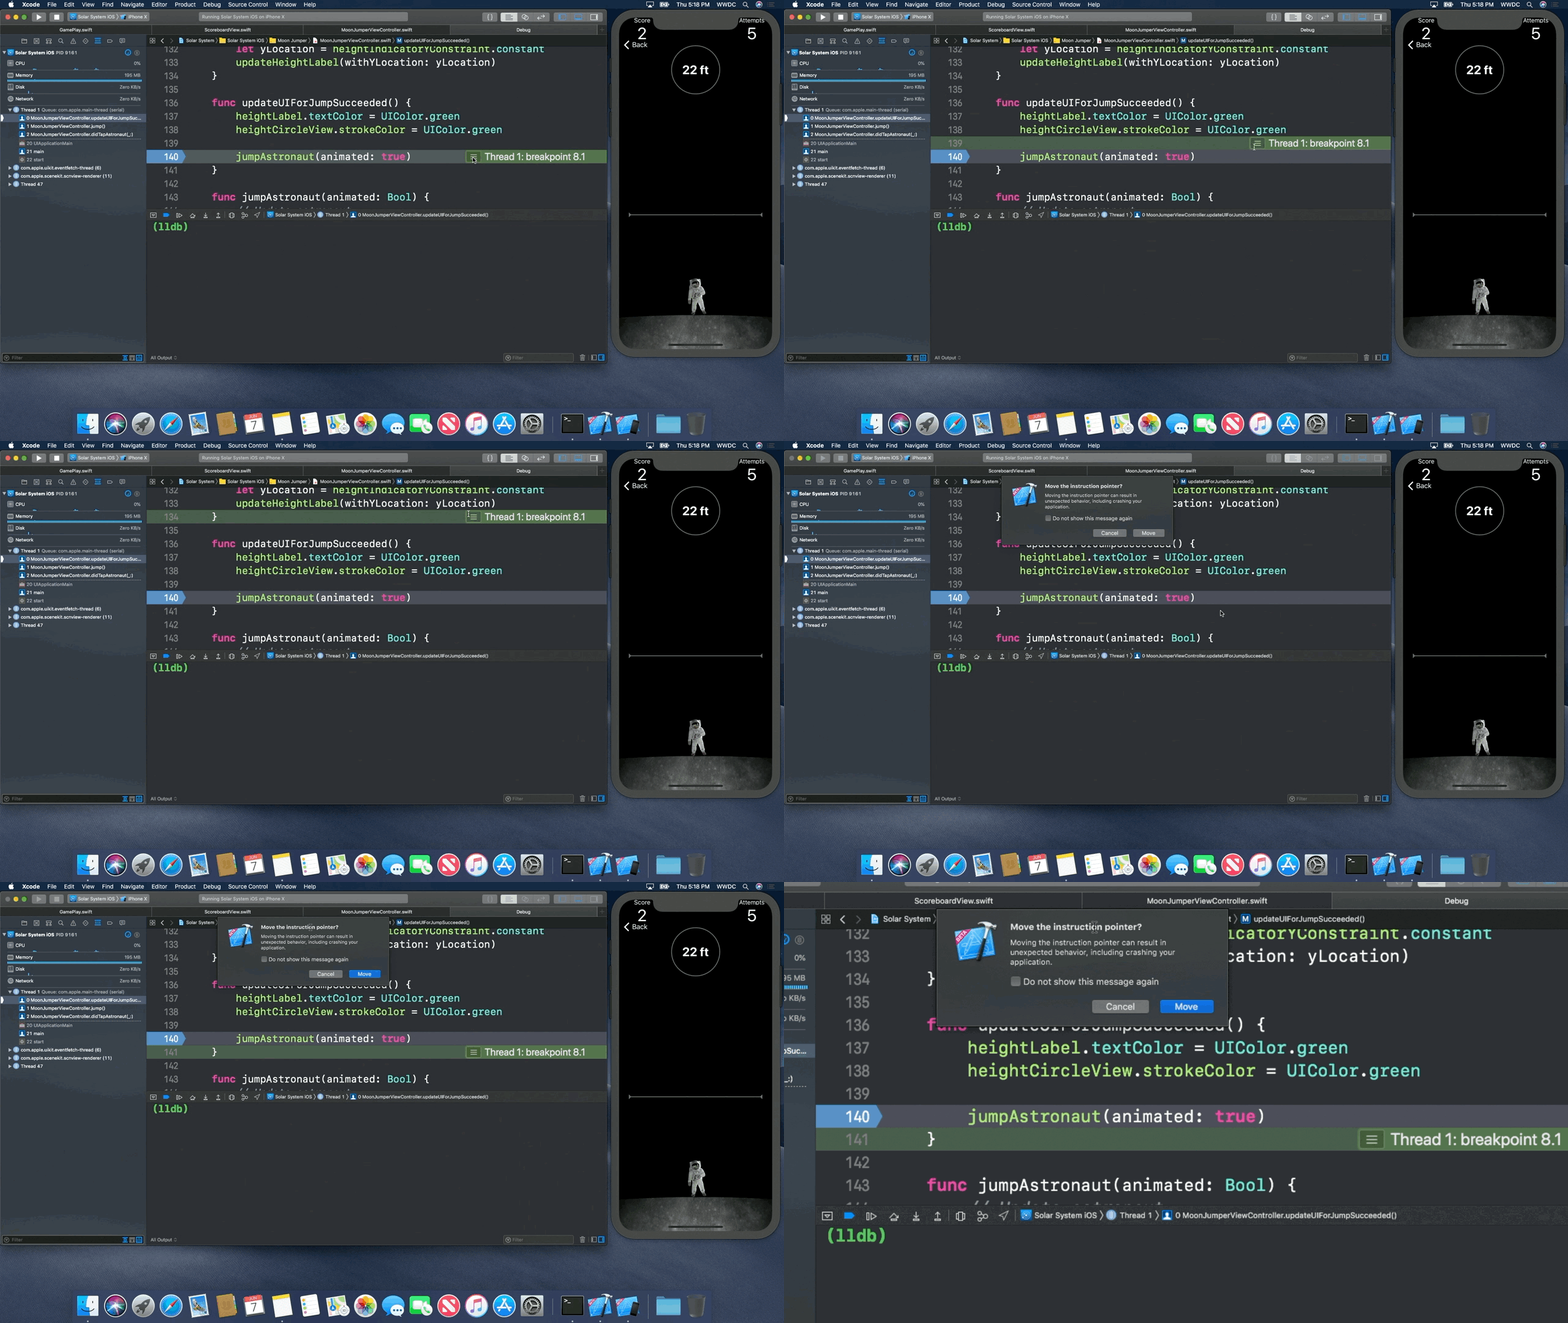
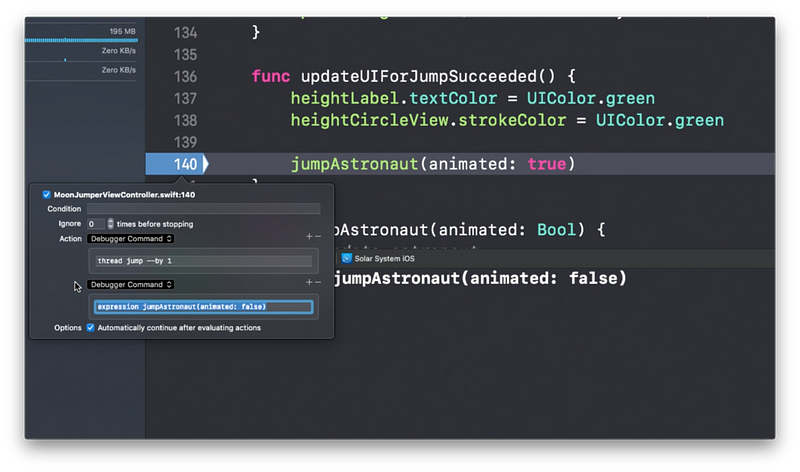
Instruction Pointer
- With great power comes great responsibility (The riskiest feature)
- It can not guarantee that the application’s state will remain intact,
i.e., memory issues
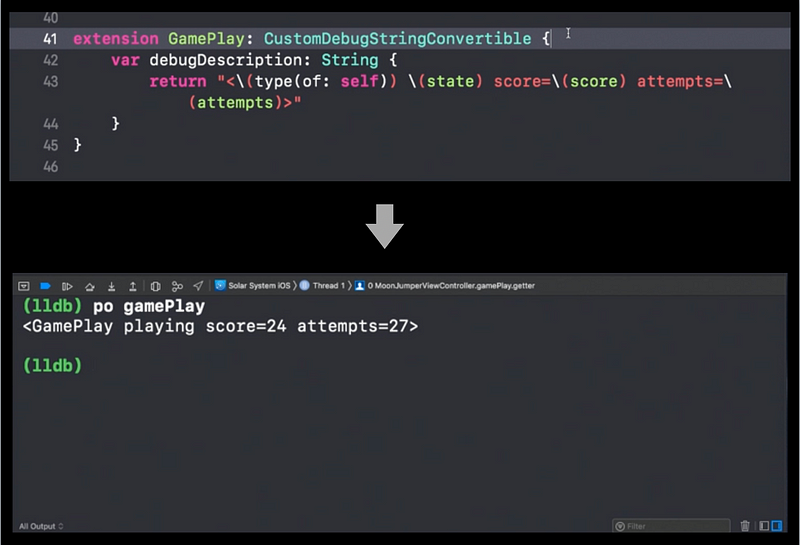
CustomDebugStringConvertible
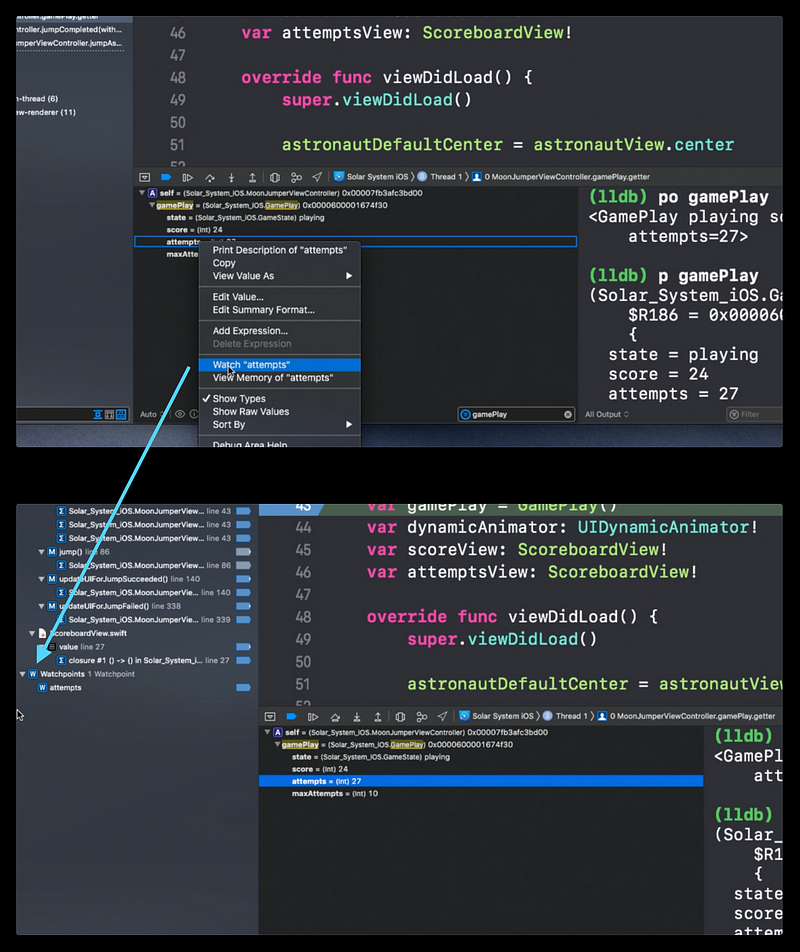
Watchpoint 👍
- It pauses the debugger the next time the value of that variable is changed.
UIView.recursiveDescription( )

unsafeBitCast(memory address, to: )

LLDB Print Commands

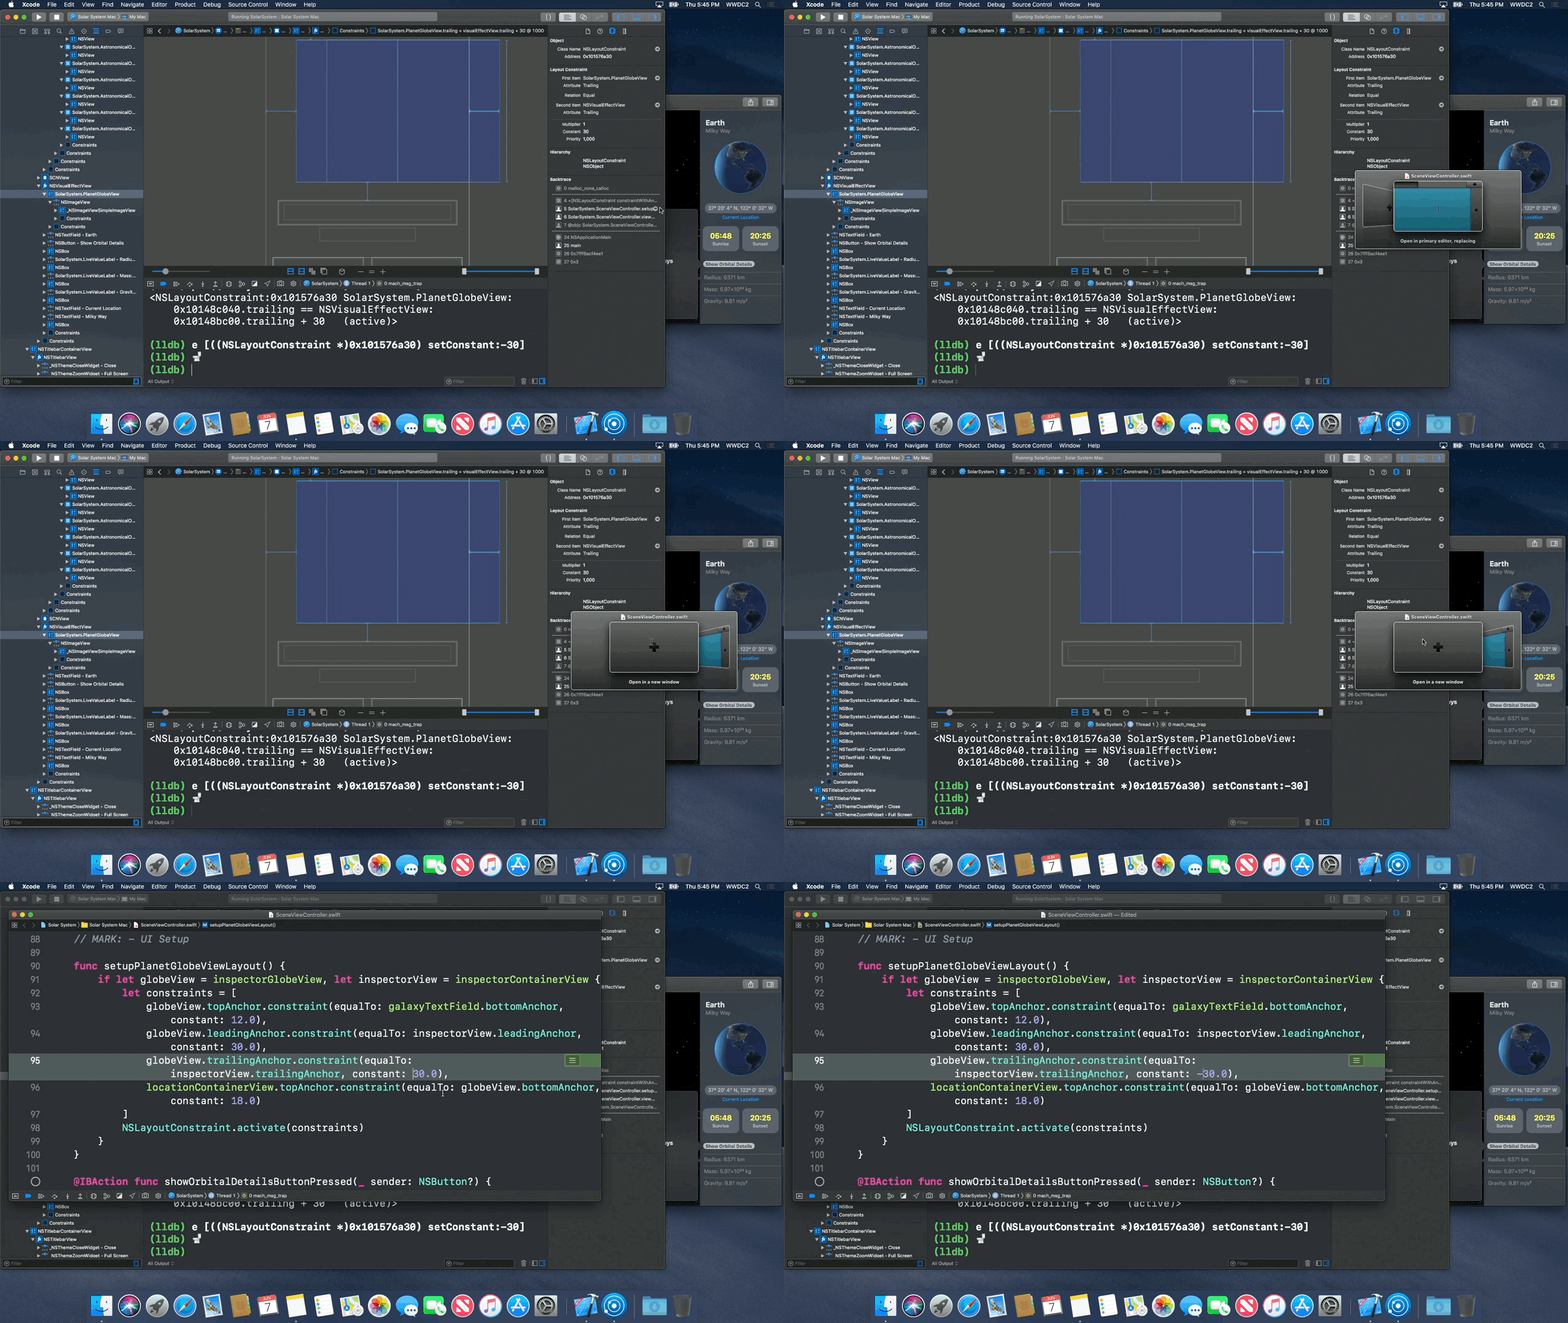
Advanced View Debugging
- You can get an object info and edit a value in debugging.
- po ((NSLayoutConstraint *)memory address)
- e [((NSLayoutConstraint *)memory address setConstant:-30]


All Allocation and Free History
- Allocation backtrack for all selected in the view debugger
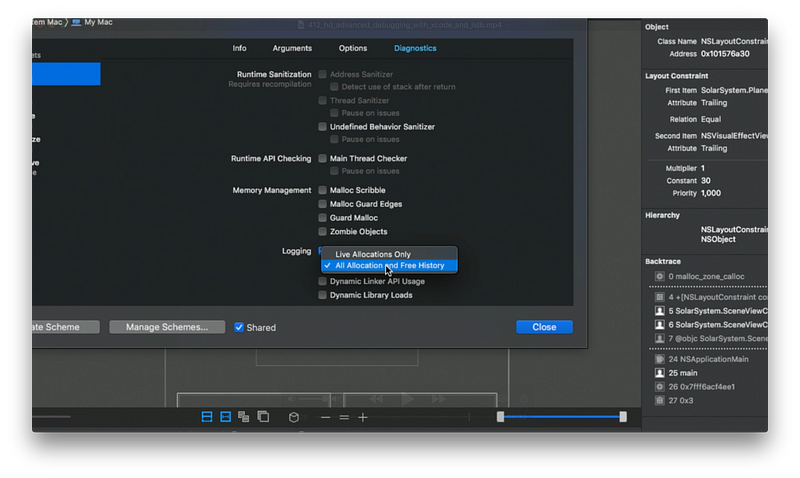
Backtrace → Go to code 👍
