Metal Shader Debugging and Profiling
Metal Shader Debugging and Profiling
WWDC 2018
Metal Frame Debugger
- Step through API calls
- Resource inspection
- Shader edit and reload
- GPU counters
- Pipeline statics
- Integrated into Xcode
- Dependency viewer (new)
- Geometry viewer (new)
- Shader debugger (new)
- Enhanced shader profiler (new)
Geometry Viewer
- Visualize the post-vertex transform data in 3D
- Access to all vertex data
- Per-draw call view
Visibly Wrong Triangles
Out of Frustum Objects
Missing Triangles
Why use Shader Debugger?
- Math heavy code
- Highly parallel
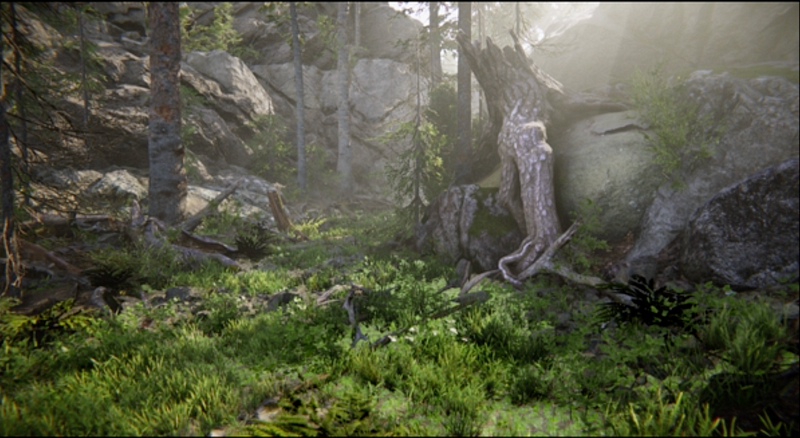
- Unity’s “Book of the Deed”
- ~10 million vertex shader invocations
- ~60 million pixels rendered
Shader Debugging
- New tool for debugging Metal shaders
- Rich variable visualization across thousands of threads
- Real data from GPU
- Flexible stepping
- Integrated into Metal Frame Debugger
Demo
Problem (negative value)
Fining the bug
Fix the Bug
Refresh
(You don’t need to rebuild)
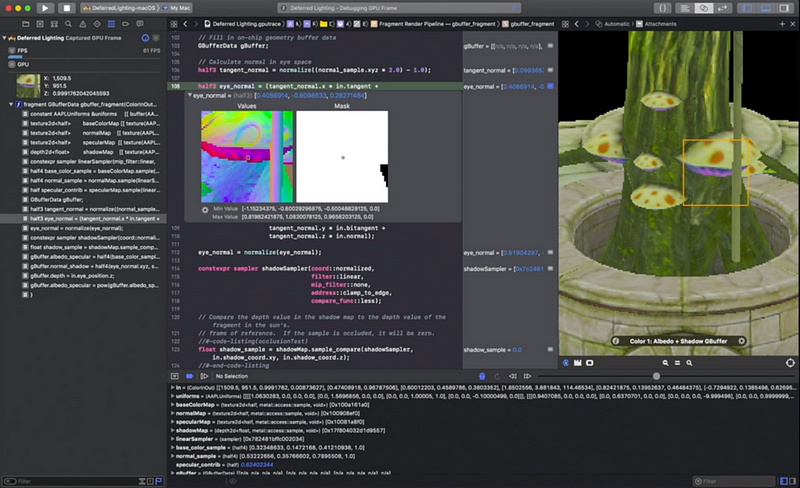
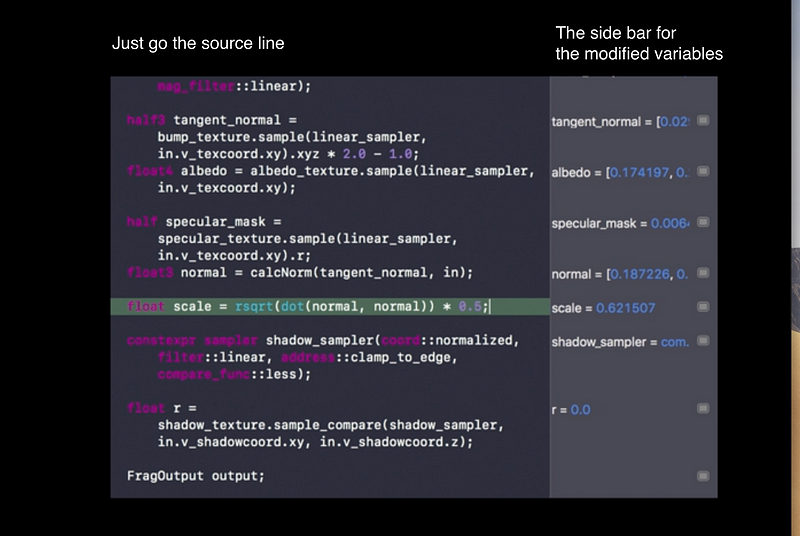
Starting the Shader Debugger
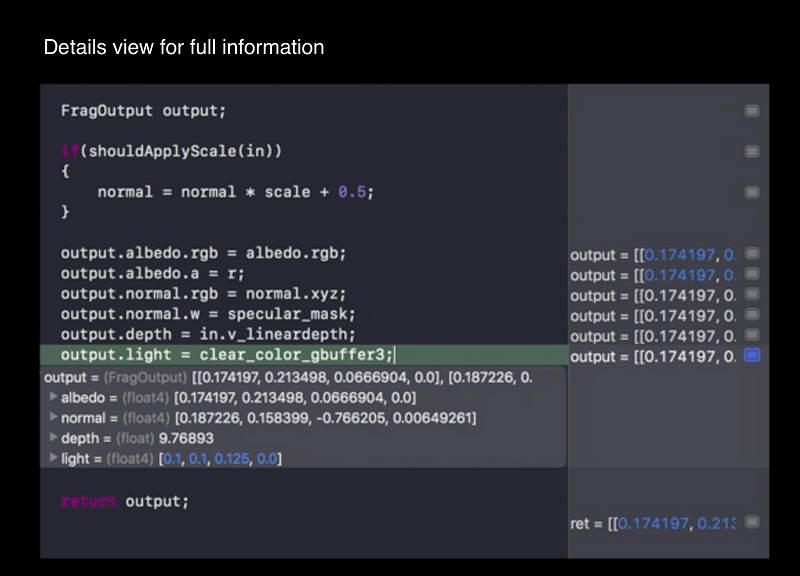
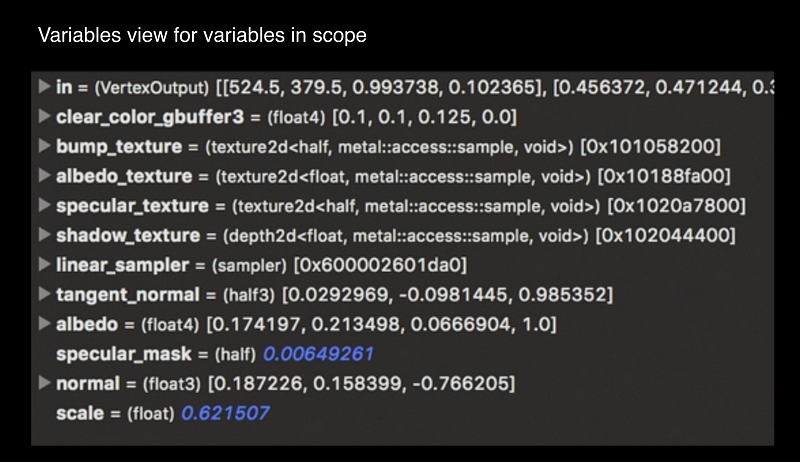
Inspecting Variables
Following the Execution
Access to Other Threads
Set of threads are available based on the initial selection
- Vertex — Primitive of the selected vertex
- Fragment — Rectangle around the selected pixel
- Compute — Threadgroup of the selected thread
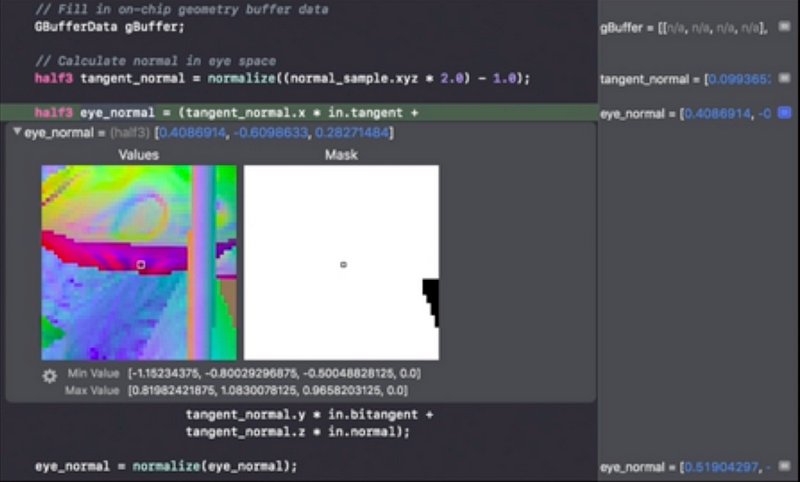
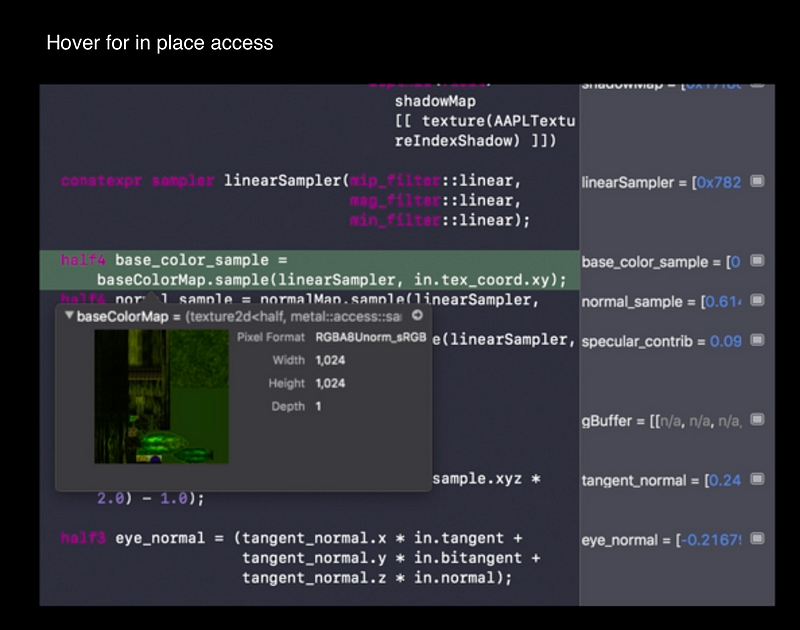
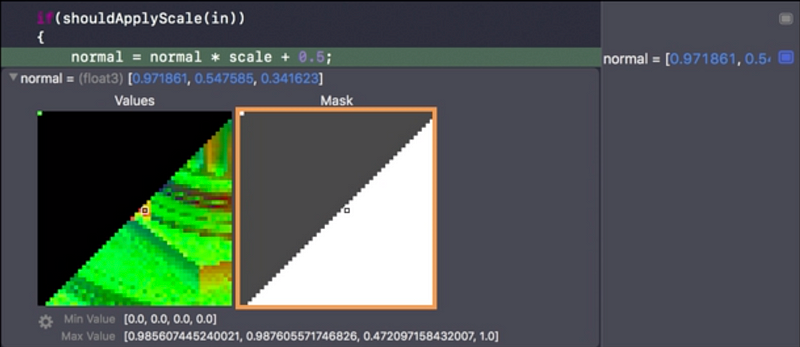
See Variables in Context
- Helps you understand your code
- Important to for comparing good/ bad values
- Hover for instant access
Comparing Good and Bad Pixels
- Quickly compare threads
- Execution history and variables and updated for the selected thread
Understanding Divergence
- Mask shows which threads executed the same line to help you understand control flow
Demo
Problem
Finding the Bug
QA

Shader Debugger
- Specifically designed for debugging Metal shaders
- Great for
- Fixing bugs!
- Understanding your shader
- Developing your shaders - Supports iOS, macOS, and tvOS
- Available in Xcode 10
Knowing What to Optimized
Profiling tools built into Metal Frame Debugger
- GPU counters
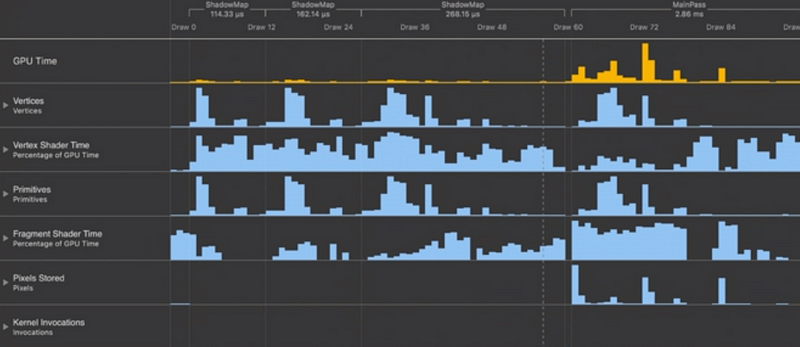
- Pipeline statistics
- Shader profiler
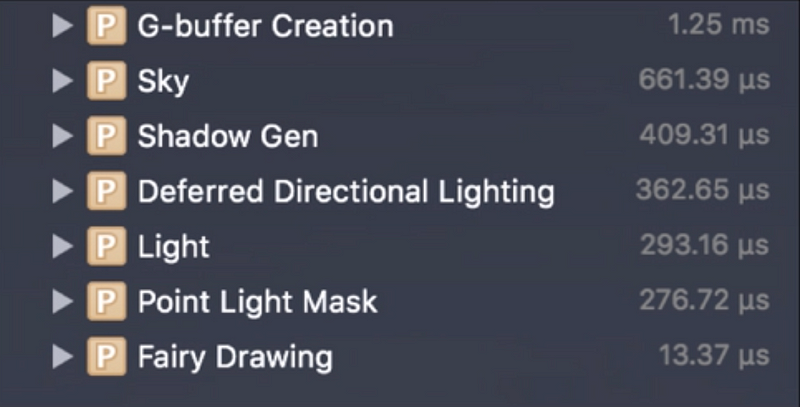
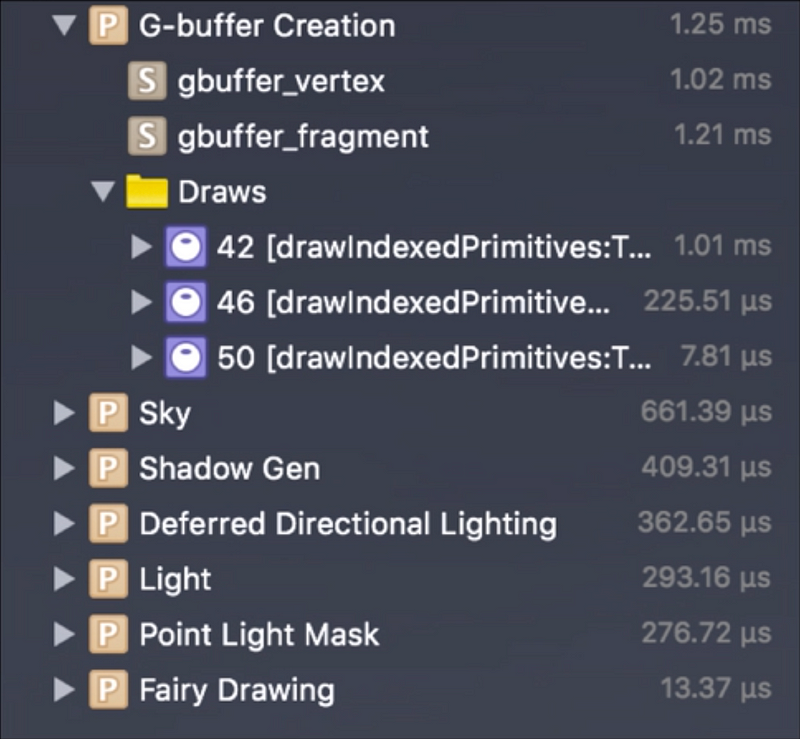
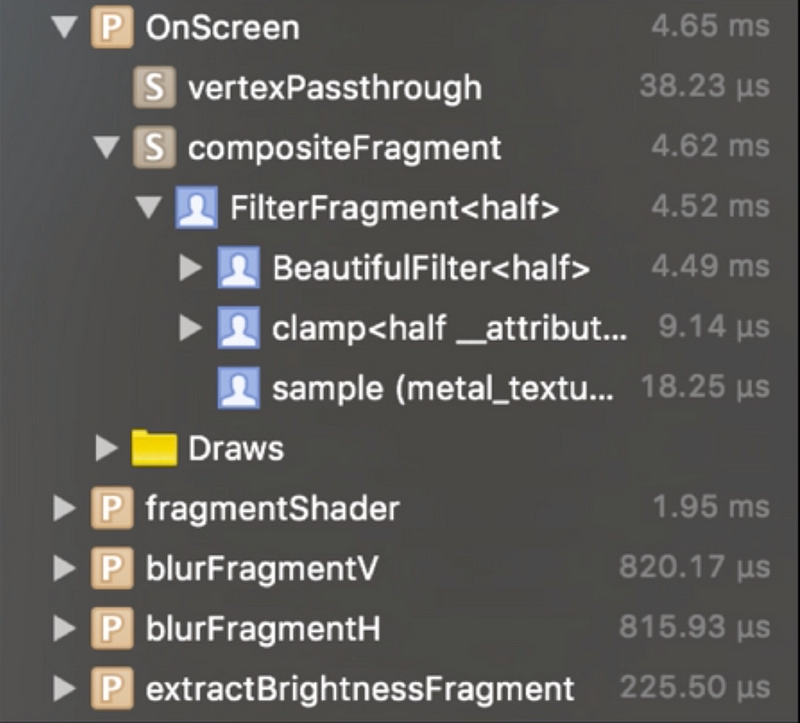
Shader Profiler
- Provides per-pipeline timing information
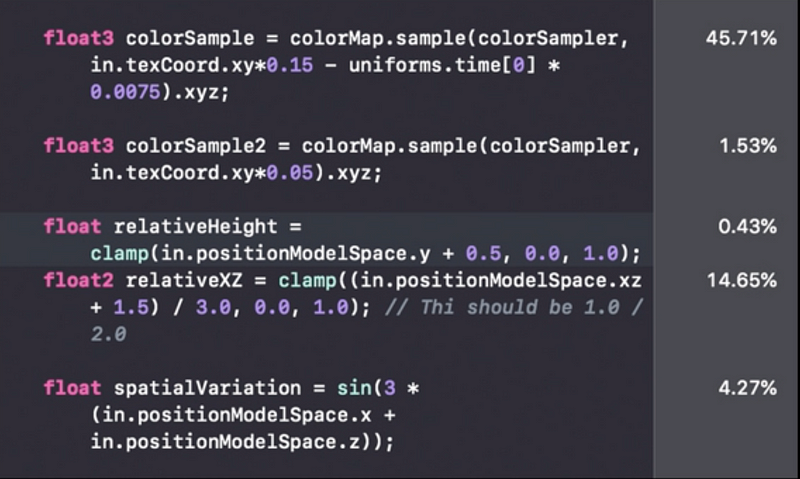
- Per-line execution cost (iOS and tvOS)
- Shader edit and reload
- Get into shader debugger
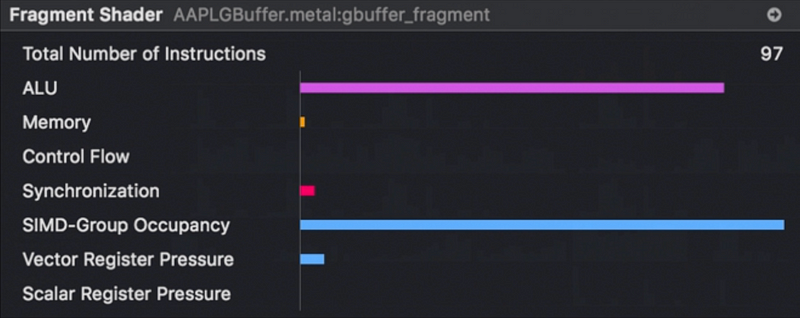
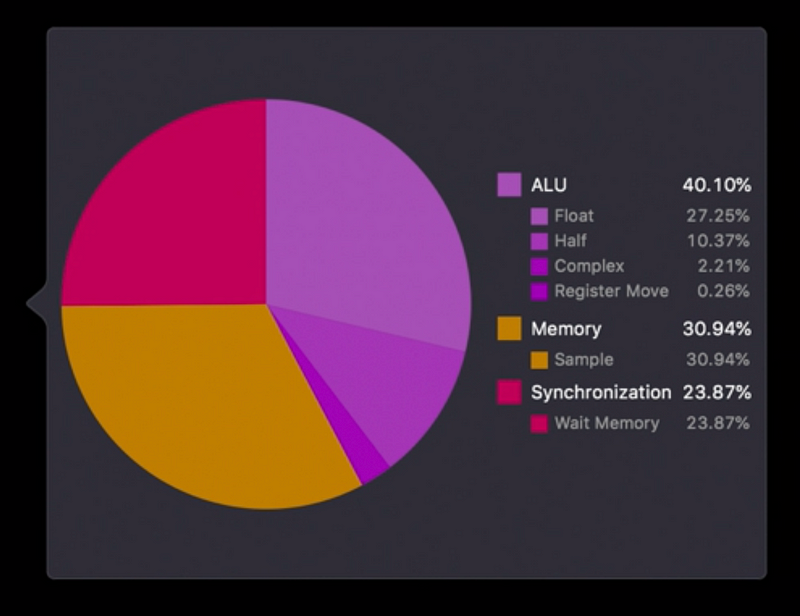
Enhanced Shader Profiler for A11
- Instruction category cost breakdown per line
- ALU — Float, half, and complex
- Memory — Sample, load, and store operations
- Synchronization — Wait memory, barriers, or atomics
- Visibility into inline function cost
Demo
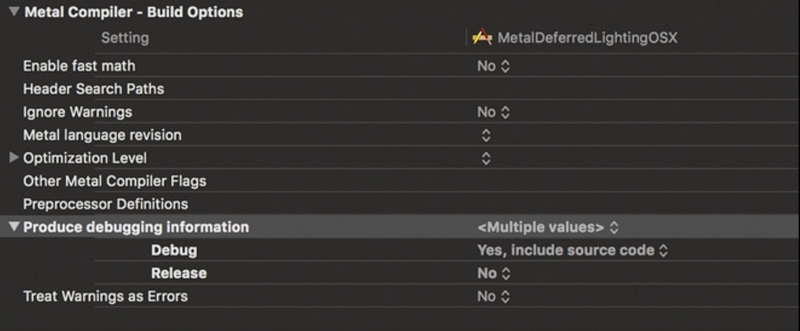
Access to Shader Sources
- New Metal Compiler option
- Xcode project
- “Yes, include source code” from build settings - Command line
- “-MO” compiler option